
Market Outlook on EU 20Y (Euro 20-Year Government Bond Yield) Today: Technical Summary, Fundamental News and a Trade Setup With Entry, Stop Loss and Take Profit for the Next 24 Hours
Market Outlook on EU 20Y (Euro 20-Year Government Bond Yield) Today: Technical Summary, Fundamental News and a Trade Setup With Entry, Stop Loss and Take Profit for the Next 24 Hours
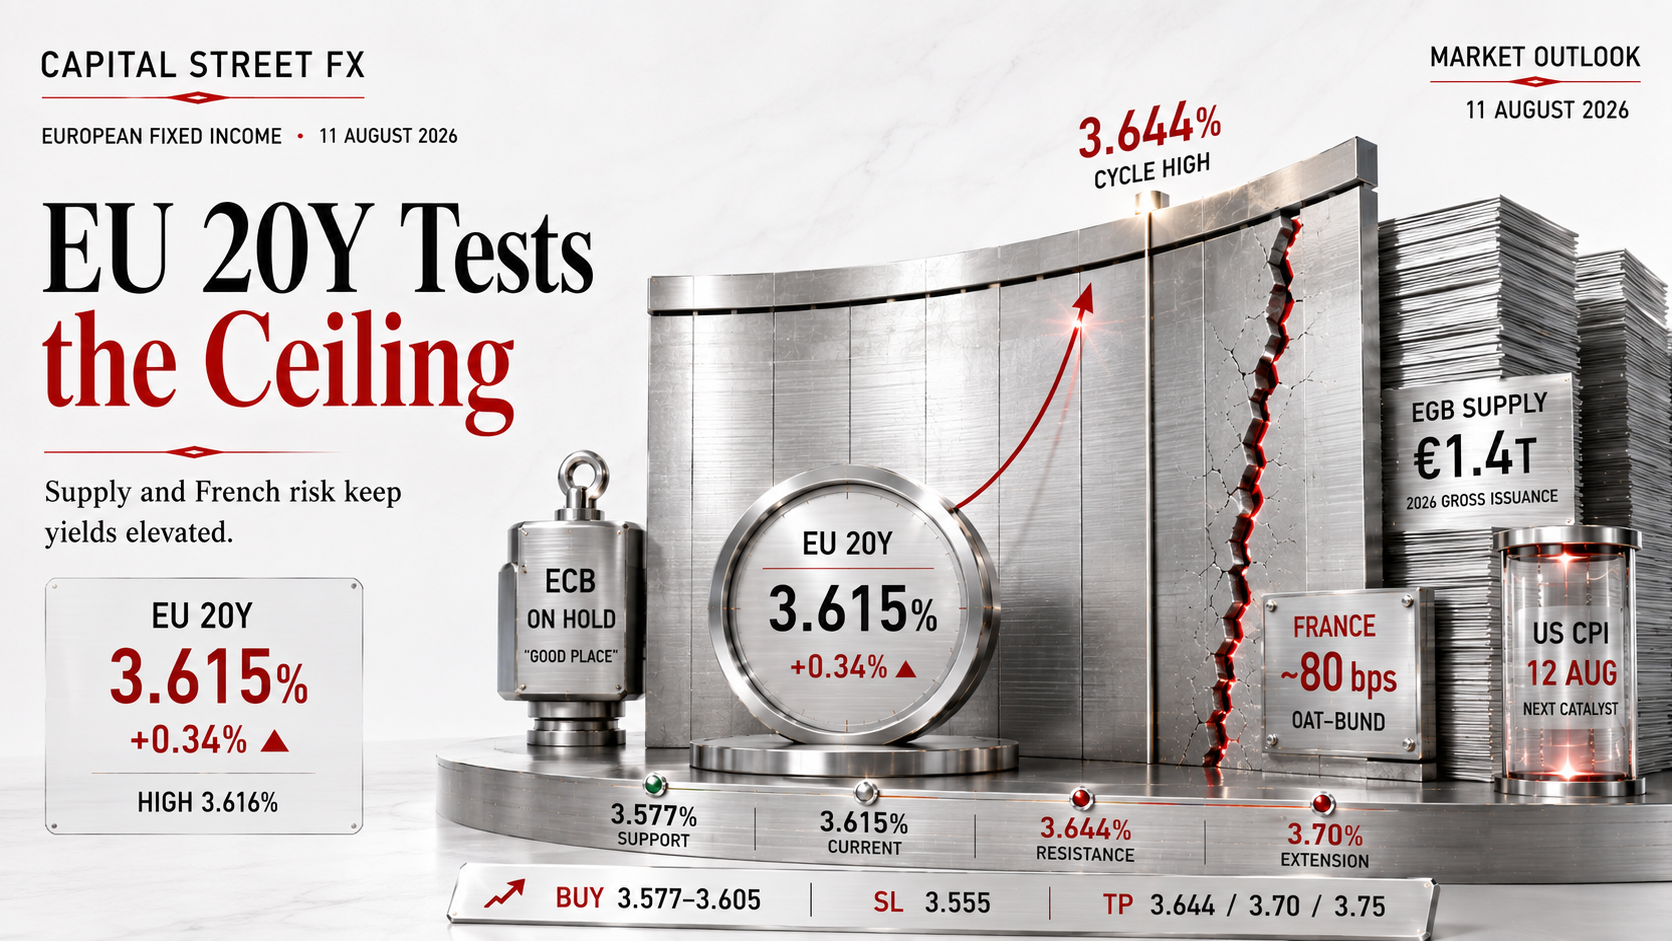
The EU 20Y yield holds near 3.615%, up 0.34%, as heavy 2026 long-dated Eurozone bond supply and French fiscal risk keep the long end of the curve under pressure.
A same-day Market Outlook on the Euro 20-Year Government Bond Yield (EU 20Y) covering today’s price action, the fundamental news most likely to move the long end of the Eurozone curve, the event calendar for the next 24 hours — closing with a trade setup that lists entry, stop loss and take profit. The EU 20Y yield is trading around 3.615%, up roughly 1.2 basis points or 0.34 percent on the day, after a session that ran from 3.605% to 3.616%. The 2026 story for long-dated Eurozone paper has been a steady climb, with the yield rebounding from a trough near 3.192% earlier in the year to press repeatedly against the 3.644% cycle-high resistance that has capped the market since the summer.
The EU 20Y yield enters the next 24 hours with several live storylines feeding into the outlook. Long-dated Eurozone government bond supply remains historically heavy in 2026, with gross issuance approaching €1.4 trillion and record net-net supply as the European Central Bank’s balance-sheet run-off reduces its own purchases, a dynamic that keeps structural upward pressure on yields at the long end of the curve. At the same time, the spread between French and German 10-year yields has widened to around 80 basis points on renewed budget uncertainty in Paris, a stress point that tends to bleed into the pricing of longer-dated Eurozone paper more broadly. That tug-of-war between abundant supply and fiscal-risk premium on one side, and a European Central Bank that continues to describe policy as being in a “good place” on the other, is what makes today’s EU 20Y setup worth trading with discipline around defined levels rather than chasing the move.
Fundamental News Set to Impact the EU 20Y Yield Next
The stories driving today’s move in the Euro 20-Year yield and shaping the outlook for the next 24 hours
Taken together, the fundamental news flow around the EU 20Y yield today points to a market where structural supply pressure and lingering political risk in France are doing most of the work, rather than any single scheduled catalyst. Record long-dated Eurozone bond issuance, combined with reduced European Central Bank purchases as its balance sheet continues to shrink, is a persistent source of upward pressure on yields that does not resolve within a single trading session. That matters because it means dips in the EU 20Y yield have tended to be shallow and short-lived throughout 2026, consistent with the broader pattern in which non-bank investors absorbing the bulk of new long-dated supply have needed higher yields to compensate for the added duration risk.
The second layer is the political risk premium building in French government debt, which continues to widen the OAT–Bund spread and to spill into pricing across longer-dated Eurozone paper generally. Add in a European Central Bank that remains comfortably on hold and a US July CPI print landing just outside today’s 24-hour window on Wednesday, and the case for today’s EU 20Y setup is a disciplined trade around the well-defined 3.644% resistance and the moving-average support cluster beneath current levels, rather than an aggressive bet on an immediate breakout.
EU 20Y Technical Summary and Chart Analysis for Today
EU 20Y daily structure, Fibonacci levels, moving averages and RSI as of 11 August 2026

The EU 20Y technical summary for today shows a yield grinding back toward the top of its 2026 range. The EU 20Y yield opened at 3.607%, dipped fractionally to 3.605%, then pushed to a session high of 3.616% before settling near 3.615%, up 0.34% on the day. That narrow daily range, arriving after a multi-month climb off the yearly low, is consistent with a market coiling just beneath a well-tested resistance level rather than one that has already broken decisively higher.
The Fibonacci grid on the EU 20Y chart is measured from the 3.644% cycle-high swing down to the 3.192% cycle-low swing. The yield is currently trading just beneath the 0% retracement at 3.644%, having already reclaimed the 0.236% retracement at 3.537% and the 0.382% retracement at 3.471% on the way up, both of which now sit well beneath price as potential support on any pullback. The 0.5% level at 3.418% and the 0.786% zone remain the next structural markers below if the current advance were to stall and reverse.
The moving averages reinforce the picture of a yield in a firm uptrend. Price is holding above a faster moving average near 3.577% and a slower moving-average cluster near 3.494% to 3.504%, with the shorter-term average sitting comfortably above the longer-term pair — a bullish stack that has persisted through most of the recent advance. Momentum is constructive without being stretched: the RSI on the daily EU 20Y chart reads 59.96 and sits above its own signal line at 57.31, a modest bullish crossover that remains well short of the overbought threshold typically associated with readings above 75.
EU 20Y Technical Levels at a Glance · Next 24 Hours
- EU 20Y resistance 1: 3.616% — the 11 August session high and the near-term breakout trigger
- EU 20Y resistance 2: 3.644% — the 0% Fibonacci retracement and the cycle-high level that has repeatedly capped rallies
- EU 20Y resistance 3: 3.70% — the first round-number extension zone above the cycle high, the outer target for the next 24 hours
- EU 20Y support 1: 3.577% — the faster moving average, the first pullback zone bulls should defend
- EU 20Y support 2: 3.537% — the 0.236% Fibonacci retracement, reinforcing the same broad zone
- EU 20Y support 3: 3.494%–3.504% — the slower moving-average cluster, a deeper support band on a sharper pullback
- Momentum: RSI 59.96 above its 57.31 signal line, mildly bullish, not yet overbought
Calendar — Events That Can Move the EU 20Y Yield in the Next 24 Hours
Key releases and events shaping the EU 20Y yield over the coming 24 hours, marked on the timeline below
| Date / Time | Event | Detail | Impact | Why It Matters for the EU 20Y Yield |
|---|---|---|---|---|
| Tue Aug 11, 09:00 CET 07:00 GMT |
European Cash Bond Open & Risk Sentiment | Broad risk-asset reaction across European rates, equities and credit at the open | 🟢 HIGH | The EU 20Y yield frequently takes its cue from early European risk sentiment; watch whether 3.577% holds as support through the session |
| Tue Aug 11, ongoing rolling |
Eurozone Long-Dated Bond Supply & Auction Flow | Rolling primary-market issuance across German, French and other Eurozone long-dated bonds | 🔴 CRITICAL | A heavier-than-expected slate of long-dated auctions would be the clearest signal that supply pressure is building toward a test of the 3.644% resistance |
| Tue Aug 11 ongoing |
French Budget & OAT–Bund Spread Monitoring | Continued tracking of the roughly 80 basis point spread between French and German 10-year yields | 🟢 HIGH | A further widening of the spread on fresh budget uncertainty in Paris would add to the risk premium priced into longer-dated Eurozone paper, including the EU 20Y |
| Tue Aug 11, 16:30 CET 14:30 GMT |
European Cash Bond Close & US Session Handover | Handover from European trading hours into the US afternoon session | 🟢 HIGH | A close that holds above 3.577% to 3.605% keeps the bullish EU 20Y structure intact heading into Wednesday |
| Tue Aug 11 – Wed Aug 12 ongoing |
ECB Speaker Commentary | Continued public remarks from European Central Bank policymakers on the rate outlook | ⚪ MEDIUM | Any shift away from the current “good place” messaging, in either a more hawkish or more dovish direction, could move the short end of the curve and indirectly affect long-end pricing |
| Wed Aug 12, 08:30 ET 13:30 GMT / 15:30 CET |
US July Consumer Price Index | Headline and core US inflation data for July 2026 | 🔴 CRITICAL | Just outside the strict 24-hour window from this report but the release most likely to move US real yields and the dollar into Wednesday’s European session, both key macro inputs into the EU 20Y forecast |
The most important point about this EU 20Y event calendar is that no single scheduled release dominates the next 24 hours the way an ECB rate decision would. Instead, the EU 20Y yield’s near-term path depends on the interplay between rolling long-dated Eurozone bond supply, ongoing monitoring of French fiscal risk via the OAT–Bund spread, and the spillover from Wednesday’s US CPI print landing just after this window closes. That is why this EU 20Y trade setup for the next 24 hours is built around a defined range with clear invalidation levels rather than a single-event breakout thesis.
EU 20Y Trade Setup for the Next 24 Hours: Entry, Stop Loss and Take Profit
EU 20Y · ~3.615% — Testing Cycle-High Resistance Near the 0% Fibonacci Level
EU 20Y · Euro 20-Year Yield
Technical Summary (Next 24 Hours)
The EU 20Y yield is trading around 3.615% after a session that opened at 3.607%, dipped to 3.605% and reached 3.616%, closing up 0.34% on the day. Price is pressing just beneath the 0% Fibonacci retracement resistance at 3.644%, with the RSI at 59.96 confirming mildly bullish but not yet overbought momentum above its 57.31 signal line. A confirmed close above 3.620% and then 3.644% opens a path toward the 3.70% to 3.75% zone.
Fundamental Driver
The dominant driver for the next 24 hours is the tension between record long-dated Eurozone bond supply, reduced ECB purchases and a persistent French fiscal risk premium on one side, and a European Central Bank that remains comfortably on hold on the other. As long as supply and spread data stay heavy, the EU 20Y yield has room to test the 3.644% to 3.70% resistance band; a sudden calming of French political risk or a dovish surprise from ECB speakers could quickly tip sentiment the other way.
Risk Management
Risk on the dip entry is roughly 2.2 to 5 basis points against a 4 to 14.5 basis point move to the staged take-profit levels, giving a risk-to-reward ratio of roughly 1:1 at TP1 and improving further at TP2 and TP3. Scale out at TP1 and trail the stop to breakeven. The EU 20Y trade idea is invalidated on a daily close below 3.555%, which would place the yield beneath the faster moving average and open the door to a retest of the 3.537% Fibonacci support.
There are two valid ways to express this EU 20Y trade idea over the next 24 hours. The patient version waits for a pullback into 3.577% to 3.605%, which is the retest of the faster moving average sitting immediately beneath current levels, entering once the yield shows signs of holding rather than fading into a deeper correction. The momentum version buys a confirmed break above 3.620% and then 3.644%, accepting a higher entry level in exchange for confirmation that the cycle-high resistance is finally giving way.
What would make this EU 20Y trade setup fail? The most likely failure mode is a sudden easing of French fiscal risk, perhaps on encouraging budget headlines from Paris, combined with a lighter-than-expected long-dated auction slate, which could trigger a reversal back through the moving-average support. If the yield breaks below 3.555% and then the 3.537% Fibonacci level, the path opens back toward the 3.471% support zone that capped the advance earlier in the year.
EU 20Y FAQ: Today’s Yield, Technicals and Trade Setup
Common questions traders ask about the EU 20Y (Euro 20-Year Government Bond Yield) on 11 August 2026
Conclusion: EU 20Y Outlook and Trade Idea for the Next 24 Hours
The EU 20Y yield is trading around 3.615%, up 0.34 percent on the day, after a tight session that ran from 3.605% to 3.616% and left the yield pressing directly against its cycle-high resistance. The next 24 hours favour a range trade around well-defined levels rather than a decisive breakout — the yield is holding above the 3.577% moving-average support, the RSI at 59.96 remains mildly constructive above its 57.31 signal line, and the persistently rejecting 0% Fibonacci level near 3.644% keeps a lid on upside until it is decisively cleared. The fundamental backdrop supports the same read: record long-dated Eurozone bond supply and a French fiscal risk premium near 80 basis points on the OAT–Bund spread are offsetting a European Central Bank that remains comfortably on hold.
The EU 20Y trade setup for the next 24 hours is to buy dips into 3.577% to 3.605% or a confirmed break above 3.620%, with a stop loss at 3.555% and take profit staged at 3.644%, 3.70% and 3.75%. Watch 3.577% as the line that separates a genuine continuation attempt from a deeper pullback toward the 3.471% support, and treat rolling long-dated auction supply, French budget headlines and Wednesday’s US CPI release as the developments most capable of changing the picture before this window closes.
This Market Outlook on the EU 20Y will be updated as new price action and fundamental developments unfold. For traders looking to act on today’s EU 20Y setup with flexible leverage and fast execution, Capital Street FX offers the tools to position around fast-moving, event-driven sessions like this one.
Explore Capital Street FX