
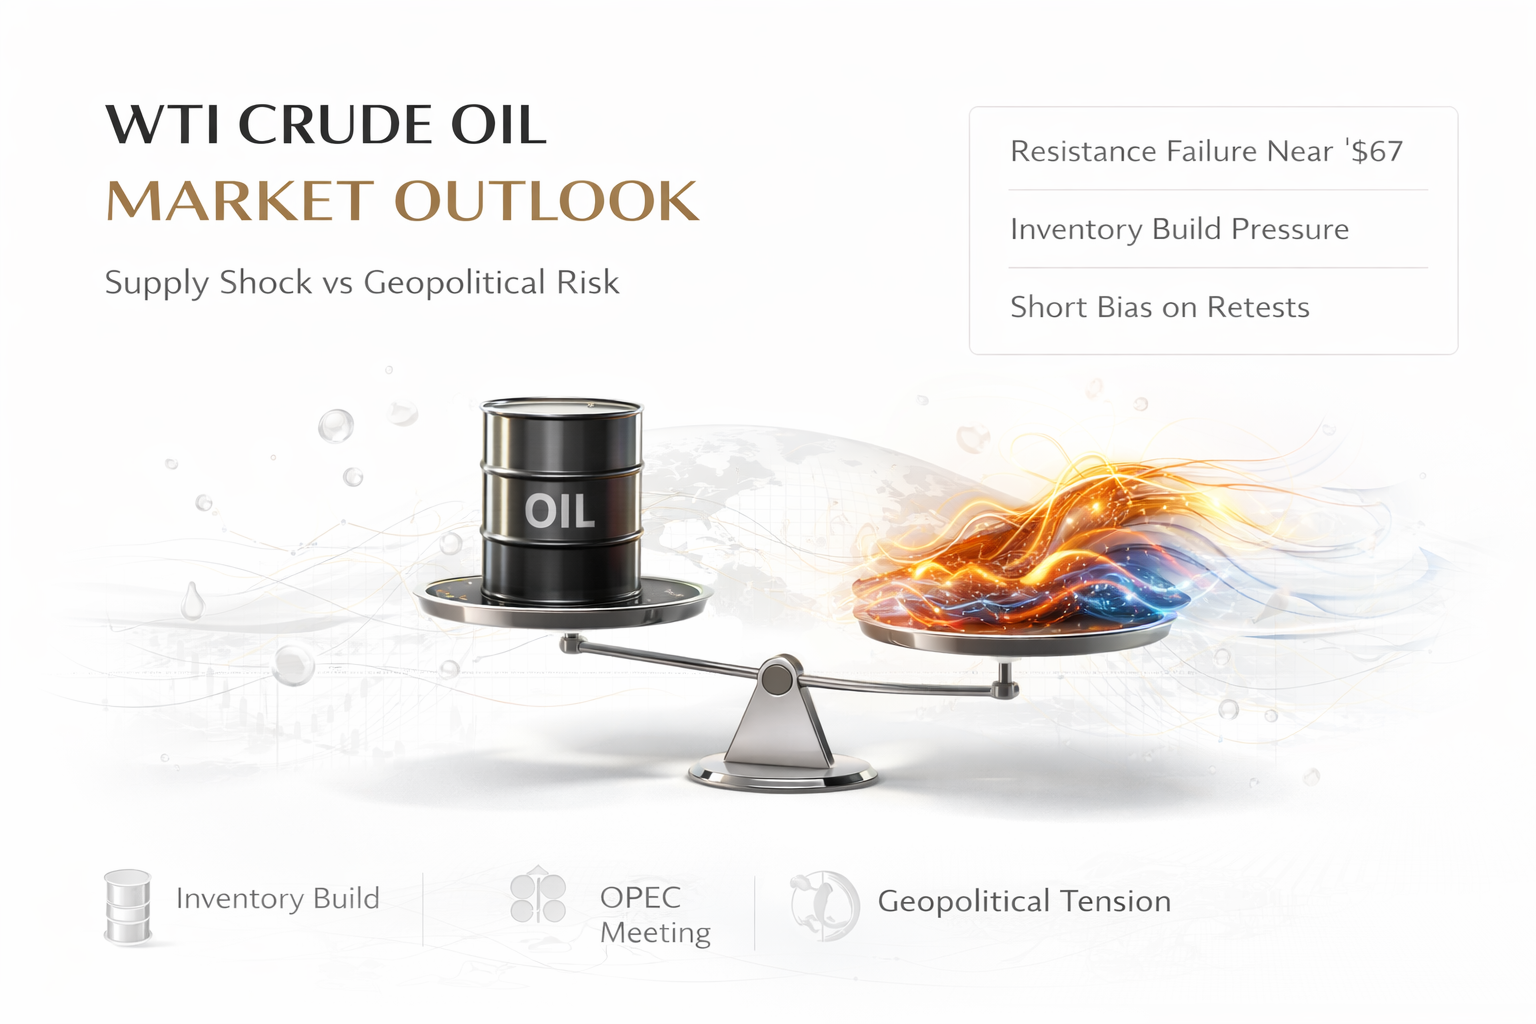
WTI Crude Oil Market Outlook – February 23, 2026 | Trade Setup, Technical Analysis & Fundamental News
A complete 24-hour technical analysis, fundamental breakdown, and structured trade setup for WTI Crude Oil on February 23, 2026 — built for active CFD and futures traders navigating geopolitical volatility and inventory-driven price action.
Live Snapshot
WTI Crude Oil (CL1!) · 4-Hour · Indicators: RSI (14), MACD (12,26,9), Bollinger Bands (20,2). Key zones: $67.06 swing high resistance, 38.2% Fibonacci at $65.02, ascending channel lower band at $63.80, 200-Day SMA at $62.40.
Daily view confirming the ascending channel structure, 200-Day SMA macro support floor, and broader Fibonacci retracement framework. RSI at neutral 52.4.
WTI crude oil is trading at $65.76 after rejecting the swing high at $67.06. The ascending channel intact since early January is under pressure on its upper boundary. With a bearish MACD cross on the 4-hour chart and RSI sitting at a neutral 52.4, the path of least resistance in the next 24 hours favors a continued corrective pullback within the channel.
The 38.2% Fibonacci retracement at $65.02 is the first major support level bears need to break through. Below there, the lower channel boundary around $63.80 and the 200-day SMA at $62.40 form a layered support structure. Price holding above the 200-SMA remains the key signal of the long-term recovery phase.
| Indicator | Value / Level | Timeframe | Signal |
|---|---|---|---|
| EMA 20 | $65.80 | 4H | Neutral |
| EMA 50 | $64.20 | 4H | Bullish |
| Bollinger Upper Band | $67.40 | 4H | Resistance |
| Bollinger Lower Band | $63.80 | 4H | Support Zone |
| ADX (14) | 28.5 | Daily | Moderate Trend |
| Stochastic RSI | 42 / 38 | 4H | Neutral → Sell |
| Williams %R | −62 | Daily | Neutral |
| CCI (20) | −18 | 4H | Mild Bearish |
The US refused Iran’s demand to relocate nuclear talks from Turkey to Oman, raising serious impasse risks. If negotiations collapse and the US proceeds with threatened military action, markets would immediately price in a potential Strait of Hormuz disruption — through which ~20% of global oil supply passes. This is the single largest upside risk catalyst for oil prices in the next 24 hours. Conversely, a breakthrough deal would trigger sharp profit-taking.
The American Petroleum Institute reported a massive inventory build of +13.4 million barrels — the largest weekly build since November 2023. The official EIA data is expected to confirm this bearish picture. A confirmed build of this magnitude signals softer demand or production surpluses, creating meaningful downside pressure on near-term WTI prices.
Note: The API and EIA data gap often causes initial overreaction followed by a correction. Traders should watch the EIA confirmation as the primary bearish trigger.
OPEC’s monthly report is due today. Markets will scrutinize demand growth projections and any signals of production policy adjustments. Signals of OPEC+ unity and output discipline support the price floor. Any hint of member nations seeking to increase quotas would act as an additional bearish catalyst, compounding the inventory-build pressure.
The International Energy Agency has flagged that oil supply is set to outpace demand, forecasting a meaningful surplus in 2026. Their Thursday assessment will be critical for medium-term price direction. This structural bearish supply narrative keeps a lid on the geopolitical risk premium even when Iran headlines spike prices temporarily.
The US-India trade framework was linked to a potential freeze on Indian purchases of Russian crude oil. India is one of Russia’s largest crude buyers — halting those purchases would reduce Russian export revenues significantly and force Russian barrels to seek alternative buyers, reshaping global crude flow dynamics and providing indirect support for WTI and Brent benchmarks.
Trigger: US announces military action against Iranian nuclear sites or Strait of Hormuz disruption reported. Probability ~30%. Only activate on confirmed headline — do not anticipate.
24H Bias: Bearish-to-Neutral
WTI crude oil enters February 23, 2026 in a technically corrective phase after bulls failed to sustain momentum above the $67.06 swing high. The ascending channel remains structurally intact from January, but the 4-hour MACD bearish cross combined with the massive API inventory build of +13.4 million barrels create clear short-term downside pressure toward the 38.2% Fibonacci at $65.02 and potentially the lower channel boundary at $63.80.
The dominant market narrative today is geopolitical: the US–Iran nuclear talks standoff is holding the market hostage between two sharply opposing outcomes. A breakdown leads to a spike toward $70+; a deal or progress triggers a sharp corrective selloff. Traders must watch for headline risk and avoid overleveraged positions in either direction.
The OPEC monthly report due today and EIA inventory confirmation tomorrow will be the two fundamental data-driven events that set the tone for the rest of the week. The IEA’s structural surplus warning Thursday is the medium-term bearish overhang.
Preferred trade for next 24H: Short re-test of $66.30–$66.60 · SL: $67.30 · TP1: $65.02 · TP2: $63.80 · R:R 1:3.7
Trade Oil
with CSFX
0.0 pip spreads · 1:10,000 leverage · Zero commission · Negative balance protection
Open Account Try Free DemoBearish bias reflects the large inventory build and technical pullback. Iran geopolitical tail risk maintains 42% bullish camp.